
What Is a Good University Average? [2026]
Ask a room of UK students whether a 63 per cent average is good and you will get three different answers: pride from the finalist who fought up from a 2:2, disappointment from the fresher who got A-stars at A-level, and a shrug from the careers adviser who only cares whether it starts with a 6. They are all answering a different question — and that is exactly why ‘what is a good university average?’ is one of the most-searched and most-misunderstood questions in UK higher education.
The honest answer is that no single number is ‘good’ in isolation. A 63 per cent average means something different in mathematics than in English literature, something different at a university where half the cohort gets a First than at one where a quarter does, and something completely different in first year than in final year. What follows is not a pep talk and not a scare piece: it is the actual data — HESA degree outcomes, OfS analysis, employer surveys — so you can place your own marks on the real map instead of guessing.
By the end of this guide you will know the national distribution of degree classifications, why the same percentage carries different weight in different subjects and universities, what each average band actually unlocks for jobs and further study, and how to work out where you stand with two fully worked examples. Every statistic below comes from a published source, linked or named — no vibes, no forum lore.
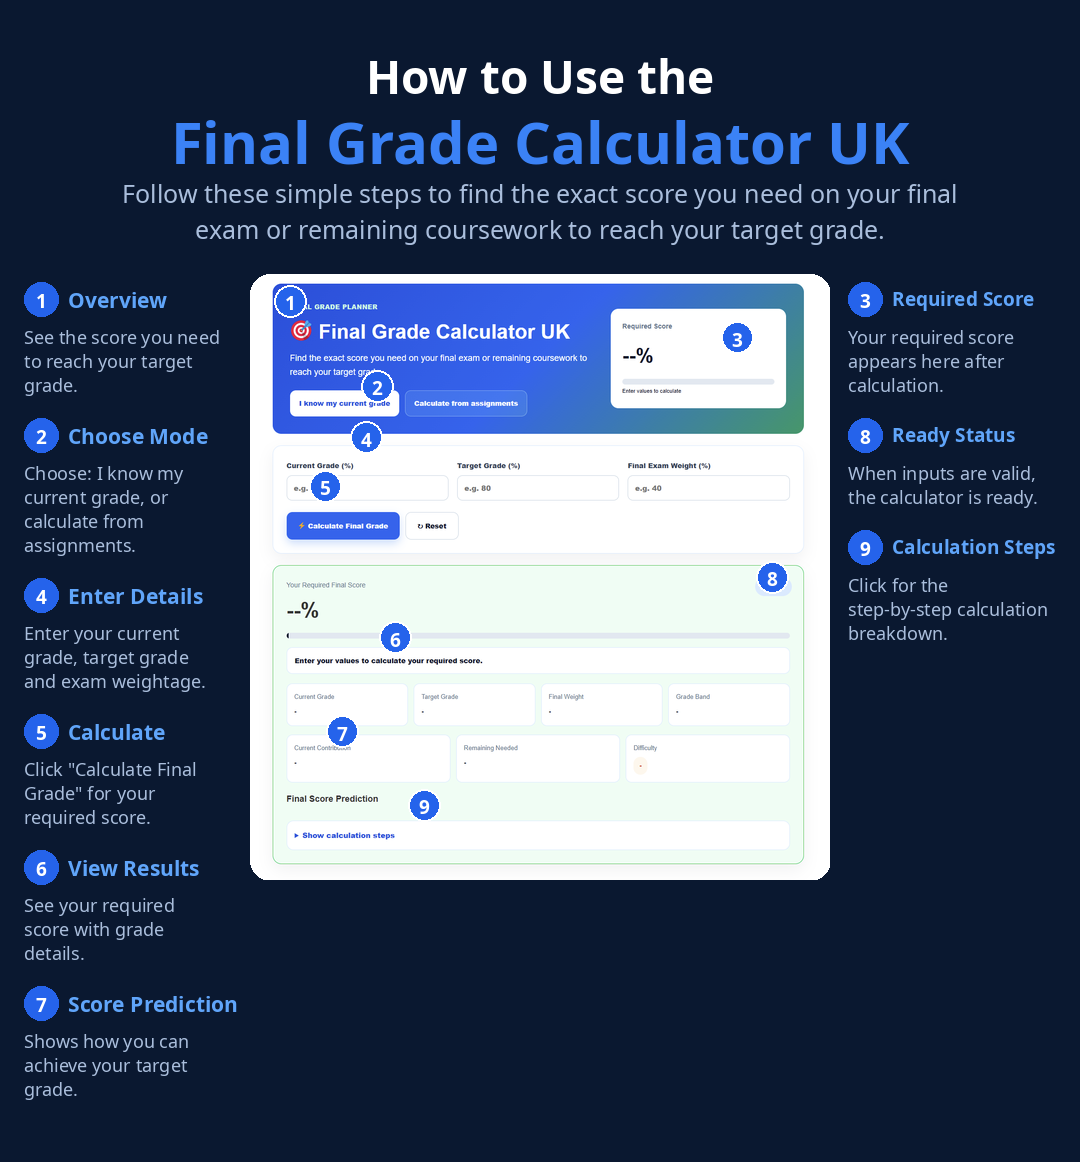
Click Here: Final Grade Calculator UK
First, the map: what the percentages actually mean
UK universities mark most undergraduate work on a 0-100 scale, and the scale converts to degree classifications at fixed boundaries. These boundaries are the single most important thing to internalise, because almost every door in the system — graduate schemes, masters entry, PhD funding — is keyed to the classification, not to the raw number behind it.
| Average | Classification | What it signals |
|---|---|---|
| 70% and above | First-class honours | Sustained first-class standard work; roughly the top 30% of graduates |
| 60–69% | Upper second-class (2:1) | The system’s default ‘good degree’; most common outcome, most doors open |
| 50–59% | Lower second-class (2:2) | A respectable pass; some doors open, many graduate schemes closed |
| 40–49% | Third-class honours | A pass, but the hardest classification to build on |
| Below 40% | Fail | Module failed; resit, repeat or compensation rules apply |
Two things about this table surprise students. First, the bands are wide: a 61 and a 69 are the same classification, and employers treat them identically at the screening stage. Second, the pass mark is 40 per cent — dramatically lower than school, where you were probably chasing 80s and 90s. Prospects puts it plainly: marks between 50 and 70 per cent are ‘normal’ at university level, with the top end of that range considered excellent, and marks of 90 to 100 are rare. If you arrived expecting your A-level percentages to transfer, recalibrate now: university marking is a different sport.
The classification is also what appears in the places that matter. Your transcript shows module marks, but your degree certificate, your UCAS-style applications and the HEDD verification service employers use all record the class. That is why this whole guide keeps coming back to one question: which band is your average in, and how secure is it?
The national picture: what ‘average’ really looks like
Here is the distribution of UK degree classifications for 2024/25, from HESA data via Prospects: 49 per cent of graduates left with a 2:1, 30 per cent with a First, 19 per cent with a 2:2, and 3 per cent with a Third. Read that again, because it reframes everything: the median UK graduate — the dead-centre student — finishes with a 2:1. A 2:1 is not ‘doing well’; it is the single most common outcome in the country.
The share of Firsts has also moved enormously within living memory. The Times reported in September 2026 that 30 per cent of students were awarded Firsts in 2024/25, compared with fewer than 13 per cent in 2006/07 — and in the early 1990s it was around 8 per cent. The pandemic peak hit 36 per cent in 2020/21; the Office for Students’ own analysis puts Firsts at 15.8 per cent in 2010/11, rising to 32 per cent in 2021/22, then easing to 28.8 per cent in 2023/24 — the third consecutive annual decline. HESA’s own statistical bulletin confirms the proportion gaining Firsts has declined year-on-year since 2021/22.
What does that mean for judging your average? Three things. First, a First today puts you in roughly the top third of graduates — an achievement, but not the rarefied distinction it was in the 1990s. Second, the OfS found that about 40 per cent of 2023/24 Firsts were ‘unexplained’ by its statistical model (entry qualifications, subjects and prior attainment accounted for) — which is why the regulator has been pressing universities to review the algorithms that convert marks into classifications. Third, and most usefully for you: because the distribution clusters so heavily at 2:1, small movements near 60 and 70 matter enormously. The difference between 59.4 and 60.4 is one classification band and a different graduate labour market; the difference between 64 and 66 is nothing at all.
One more piece of context before we get personal: the 30 per cent Firsts figure is a national average that hides dramatic variation. Which brings us to the two factors that change what your number means.
Why the same number means different things: subjects and universities
A 65 per cent average is not the same achievement everywhere, because marking cultures differ. The Times’ analysis quotes higher-education adviser Mike Ratcliffe: science, technology, engineering and maths degrees ‘typically award more firsts’, while ‘it is trickier in subjects such as English and history where the answer is not right or wrong, as it is in Stem subjects.’ His summary line is worth memorising: ‘Historically, quantitative subjects have felt more comfortable giving marks at the top end.’ A 68 in mathematics and a 68 in English literature are both strong 2:1s on paper, but the mathematician’s mark sits closer to their subject’s centre of gravity than the literature student’s does.
Universities differ just as sharply, and they now publish the evidence themselves. Every UK university produces a degree outcomes statement — and the numbers are striking. Imperial College London awarded 53 per cent Firsts in 2024/25, the highest of any Russell Group university; UCL awarded 41 per cent, Durham 40 per cent, Manchester 38 per cent (all via The Times’ HESA analysis). At the other end, UWE Bristol’s 2023/24 statement shows 24.8 per cent Firsts against a 29.1 per cent sector average, and UEA’s five-year record sits between 22 and 28 per cent. Your 63 per cent lands in a very different percentile at Imperial than at UWE.
The practical takeaway: judge your average against your own course’s distribution first and the national distribution second. Many departments publish module mark distributions or previous years’ classification splits — ask your personal tutor, or check your university’s degree outcomes statement. A 62 that sits above your cohort median is a better signal than a 66 that sits below it, because employers and admissions tutors increasingly read applications with institutional context in mind. Our guide to whether UK universities curve grades explains the moderation machinery behind these differences.
The benchmark ladder: what each average actually unlocks
Numbers only matter because of the doors they open. This ladder translates average bands into the opportunities they typically unlock — the original reference this guide is built around. Treat it as a map, not a guarantee: individual employers and courses vary, but these are the thresholds the sector actually uses.
| Your average | Classification | What it typically unlocks |
|---|---|---|
| 70%+ | First | Everything below, plus: funded PhD shortlists, the most competitive graduate schemes, top-tier teacher-training bursaries, strongest position for academic jobs |
| 65–69% | 2:1 (upper) | All standard graduate schemes; comfortable for taught masters entry; ‘strong 2:1’ language on applications |
| 60–64% | 2:1 (lower) | The main employer gate: the ISE survey found 44% of employers require a 2:1. Most taught masters courses accept 60%+. The single most valuable band to defend. |
| 55–59% | 2:2 (upper) | Many graduate schemes still open — BAE Systems, the Civil Service, the NHS, Network Rail and Tesco all accept 2:2s (Prospects). Taught masters possible, often with experience. |
| 50–54% | 2:2 (lower) | Fewer structured schemes; masters entry harder but not impossible with a strong personal statement and references |
| 40–49% | Third | Graduate schemes largely closed; further study usually requires a masters first or substantial experience |
Study the gap between 59 and 60. It is the single most expensive percentage point in UK higher education: crossing it moves you from the 19 per cent of graduates with a 2:2 into the 79 per cent with a 2:1 or better, and past the screening filter used by nearly half of graduate employers. If your average is hovering anywhere near 60, that boundary deserves more of your revision time than any other number in this guide. Our 2:2 to 2:1 recovery guide is built for exactly this situation.

Worked example 1: Priya’s 63.4% — and what a First would take
Priya is in second year of a history degree at a university that weights years 40:60. Her Year 2 average is 61 per cent; her Year 3 average (so far) is 65 per cent. Her final average is therefore:
(0.40 × 61) + (0.60 × 65) = 24.4 + 39.0 = 63.4 per cent — a 2:1.
Where does 63.4 sit? Nationally, it is above the median graduate (the median sits inside the 2:1 band, and 63.4 is in the upper portion of it). For jobs, it clears the 2:1 filter every employer uses. For a taught masters, it meets the standard 2:1 entry requirement. It is, by every external measure, a good average — the kind of result that keeps every normal door open.
Now the question Priya actually asked: what would a First take? Her Year 2 mark is banked at 61, so the whole burden falls on Year 3:
0.40 × 61 + 0.60 × Y3 = 70 → 24.4 + 0.60 × Y3 = 70 → 0.60 × Y3 = 45.6 → Y3 = 76.0 per cent.
Priya would need to lift her final-year average by 11 points, from 65 to 76 — a full classification band of improvement. That is possible (a strong dissertation helps: at 30-40 credits it can move a year average by several points), but it is a serious undertaking, not a tweak. This is the honest arithmetic most students never do: the distance from a good 2:1 to a First is usually larger than it feels. Model your own numbers with the Final Grade Calculator UK before deciding how hard to chase it.
Worked example 2: James’s 58.5% and the one-module trap
James is in final year of a business degree, also 40:60 weighted. His Year 2 average is 57.0 per cent. His six final-year modules (20 credits each) came back as 62, 65, 58, 48, 64 and 60. His Year 3 average:
(62 + 65 + 58 + 48 + 64 + 60) ÷ 6 = 357 ÷ 6 = 59.5 per cent.
His final average: (0.40 × 57.0) + (0.60 × 59.5) = 22.8 + 35.7 = 58.5 per cent — a 2:2, one and a half points short of the 2:1 line.
Now watch what one module did. Replace that single 48 with a 68 — strong, but the same student’s other modules show he is capable of it:
Year 3 becomes (62 + 65 + 58 + 68 + 64 + 60) ÷ 6 = 377 ÷ 6 = 62.83 per cent. Final: 22.8 + (0.60 × 62.83) = 22.8 + 37.7 = 60.5 per cent — a 2:1.
One 20-credit module, twenty marks higher, moved James across the most expensive boundary in the system. This is why averages near 60 deserve forensic attention to your weakest modules: the Degree Classification Calculator UK lets you test exactly this kind of counterfactual, module by module. And it is why borderline rules exist — if you finish at 59.5 rather than 58.5, exam-board discretion may do the last bit of lifting for you.
Good in first year is not the same as good in final year
Everything above describes final averages — but students usually ask ‘is this good?’ about a first-year or second-year mark, where the answer is deliberately different. Prospects’ guidance is the honest baseline: anything over 50 per cent counts as a good mark in your first year, and marks between 50 and 70 are normal across all years, with the top end considered excellent. A 58 in first year is not a warning sign; it is a starting point.
There is also a structural reason not to panic about early marks: at many universities, first year does not count toward your classification at all. The common 0:40:60 and 0:30:70 weighting models mean your Year 1 average can be anything — 52 or 82 — without moving your final classification a single point. Our first-year weighting guide walks through the five models UK universities actually use, with the arithmetic for each.
The benchmarks that matter are the final-year ones, because final year is almost always the most heavily weighted — and because it contains the dissertation, the single highest-credit assessment most students ever take. A 30-credit dissertation at 68 instead of 58 moves a 120-credit year average by 2.5 points, which at 60 per cent year-weighting is 1.5 points on your final classification. That is the difference between James’s 58.5 and 60.0. Choose your dissertation effort accordingly.
What employers and admissions tutors actually see
Here is the part students routinely get wrong: employers do not see your 63.4. They see ‘2:1’. Graduate application forms ask for degree classification; the screening software filters on it; and when offers are verified, they go through HEDD, the official degree-verification service, which confirms the classification on your certificate. Your precise average matters enormously to you — it determines the class — and barely at all to anyone else, except as a tiebreak between otherwise identical candidates.
Admissions tutors for taught masters work the same way: the published requirement is almost always ‘a 2:1’, meaning a 60 per cent average, with some courses accepting a 2:2 plus relevant experience. Once enrolled, the scale resets: 50 is the pass mark, 60 earns a Merit, 70 a Distinction — our masters grading guide covers the full picture. Funded PhD places are the strictest audience of all, typically demanding a 2:1 or First before they will even read the proposal.
One honest caveat, because the data demands it. Reed’s chairman James Reed told The Times that ‘the class of degree has almost become irrelevant for employers’ given how many Firsts and 2:1s are now awarded — and the ISE survey backs the direction of travel, with the share of employers demanding a 2:1 falling from 76 per cent in 2013-14 to 44 per cent. The filter is weakening, not gone. For now, the 2:1 remains the line that matters — but the trend is one more reason to build skills and experience alongside the number. Our full analysis is in does your degree classification matter.
Seven myths about ‘good’ university grades, debunked
Before the FAQs, a clear-out of the misconceptions this guide’s data contradicts most directly:
| The myth | What the data actually says |
|---|---|
| You need 80–90%+ to do well | Marks of 90–100 are rare at university level (Prospects). The 50–70 range is normal; the top end of it is excellent. A 68 is a strong mark, not a disappointment. |
| A First is the only ‘good’ degree | 30% of graduates get a First, but 49% get a 2:1 — the most common outcome — and a 2:1 unlocks most graduate jobs and masters courses. |
| A 2:2 is worthless | A 2:2 is a respectable pass, and major employers — BAE Systems, the Civil Service, the NHS, Network Rail, Tesco — accept 2:2s onto graduate schemes (Prospects). |
| 70% means the same everywhere | Firsts range from 53% of graduates (Imperial) to under 25% (UWE Bristol, 2023/24). Judge your mark against your course’s distribution. |
| First year grades don’t matter at all | Often zero-weighted for classification — but they decide progression, prerequisites, references and your study habits. Our first-year guide has the details. |
| Employers recalculate your average | They filter on classification (verified via HEDD), not your precise percentage. The 63.4 matters to you; the 2:1 matters to them. |
| Grade inflation made the 2:1 meaningless | The OfS found ~40% of 2023/24 Firsts ‘unexplained’ — but 44% of employers still gate on a 2:1. The filter weakened; it did not disappear. |
What is a good average at university in the UK?
Anything at 60 per cent or above — a 2:1 — counts as a strong university average in the UK. HESA data for 2024/25 shows 49 per cent of graduates left with a 2:1, making it the single most common outcome, and the ISE graduate survey found 44 per cent of employers still use a 2:1 as their screening threshold. A 65+ average puts you in the upper half of 2:1 holders, and 70+ — a First — puts you in roughly the top 30 per cent of graduates. Below 60, the average is not ‘bad’ (a 2:2 remains a respectable pass), but fewer graduate schemes and taught masters courses will be open to you without extra experience.
Is 60% a good mark at university?
Yes. Sixty per cent is the boundary of a 2:1, and a 2:1 is the outcome the UK system is built around: it is what most graduate employers ask for, what most taught masters courses require for entry, and — at 49 per cent of all graduates in 2024/25 — the most common degree classification in the country. One caution: 60 per cent on the nose is a borderline 2:1, so check how your university handles borderline candidates — our guide to how universities round marks explains the discretion rules.
Is 70% hard to get at university?
Genuinely hard, yes — and getting harder to stand out with. Around 30 per cent of UK graduates now leave with a First (up from under 13 per cent in 2006/07, per HESA via The Times), so 70+ puts you in the top third of graduates rather than a tiny elite. The marking culture matters too: Prospects notes that marks between 50 and 70 per cent are ‘normal’ at university level with the top end considered excellent, and marks of 90-100 are rare. A 70 average means consistently producing work your markers judge to be of first-class standard — not perfection, but sustained excellence.
What is the average university grade in the UK?
The median UK graduate leaves with a 2:1: in 2024/25, 49 per cent of graduates got a 2:1, 30 per cent a First, 19 per cent a 2:2 and 3 per cent a Third (HESA, via Prospects). That means half of all graduates finish somewhere in the 60-69 per cent range. But ‘average’ hides big differences: STEM subjects award far more Firsts than essay-based subjects like English and history, and individual universities range from 53 per cent Firsts (Imperial) to under 25 per cent (UWE Bristol, 2023/24). Judge your average against your own course’s distribution, not the national one.
Is a 2:1 good enough for graduate jobs?
For most graduate jobs, yes. The ISE Student Recruitment Survey found 44 per cent of employers require a 2:1 — a record low, down from 76 per cent in 2013-14 — and 18 per cent set no minimum at all. Many leading employers, including BAE Systems, the Civil Service, the NHS, Network Rail and Tesco, accept 2:2 graduates onto their schemes (Prospects). A First helps for the most competitive schemes and funded PhDs, but for the bulk of the graduate market the 2:1 is the line that matters — which is why protecting your average around the 60 per cent boundary pays off. See our full breakdown in does your degree classification matter.
Does it matter which university your 2:1 is from?
Less than students think, but it is not nothing. Universities publish degree outcomes statements showing their own classification profiles: in 2023/24 UWE Bristol awarded 24.8 per cent Firsts against a 29.1 per cent sector average, while Imperial awarded 53 per cent. Employers overwhelmingly filter on the classification itself — a 2:1 is a 2:1 on the application form — though a handful of elite firms do look at institution. What matters more in practice is what sits behind the number: work experience, skills and references. And every employer that checks does so through HEDD, the official degree-verification service, so the class on your certificate is the class they see.
Is 55% in first year bad?
No — it is a perfectly respectable first-year average. Prospects advises that anything over 50 per cent counts as a good mark in your first year, and first-year marks are frequently excluded from your final classification entirely (many universities weight years 0:40:60 or similar). Treat 55 per cent as a solid baseline, not a verdict: the same effort profile usually produces higher marks in later years as you learn how university marking works. The danger is only complacency — first year builds the study habits and prerequisite knowledge your final-year modules assume. Our first-year weighting guide shows exactly how much each year counts.
What average do I need for a masters degree?
Most UK taught masters courses ask for a 2:1 — a 60 per cent average — as the standard entry requirement, with some accepting a 2:2 plus relevant work experience. Once you are on the masters, the thresholds shift: 50 per cent is the pass mark, 60+ earns a Merit and 70+ a Distinction. Funded PhD places are stricter again, typically demanding a 2:1 or First. If your final average lands just under 60, use our Final Grade Calculator UK to see exactly what your remaining modules need to average to pull you over the line — near-misses are often recoverable with a strong dissertation.
Conclusion
So: what is a good university average? The data gives a clear, unsentimental answer. Sixty per cent — a 2:1 — is the line that matters most: it is the most common outcome in the country, the threshold nearly half of graduate employers screen on, and the standard entry requirement for taught masters courses. Sixty-five and above is comfortably strong. Seventy and above puts you in the top third of graduates. Below sixty, the average is not a disaster, but the doors narrow — and the closer you are to the boundary, the more every remaining mark is worth.
The second answer is that your number only means something in context. A 63 in a subject and university where the cohort median is 58 is a better signal than a 66 where the median is 70 — check your department’s distributions and your university’s degree outcomes statement before you decide how to feel about your marks. And remember what the worked examples showed: near a boundary, a single module can move a classification, which makes targeted effort on your weakest remaining assessments the highest-value studying you can do.
If you take one action from this guide, make it this: put your actual marks into the Final Grade Calculator UK and find out exactly what your remaining modules need to average for the classification you want. Students who do the arithmetic stop guessing whether their average is ‘good’ — they know precisely how good it needs to be, and what it will take to get there.