In 2010-11, roughly one English graduate in six left university with a first-class degree. By 2023-24, it was closer to one in three-and-a-half. The peak — 37.7 per cent during the pandemic — has eased, but the long-run direction is unmistakable: firsts have nearly doubled in thirteen years. Statisticians call this degree grade inflation: a sustained rise in the share of top classifications awarded without a matching rise in the measurable achievement behind them.
This article is the data story, written for the people the numbers are actually about. It is not a lament about standards and it is not a defence of them — it is an explanation of what the Office for Students’ latest analysis found, what ‘unexplained attainment’ really means, why it happened, and — the question students actually ask at 1am — whether it makes your degree worth less. Spoiler: the answer is more reassuring, and more complicated, than the headlines suggest.
One framing note before the numbers. When regulators say ‘unexplained’, they are describing what a statistical model cannot account for — not handing out verdicts on individual students or universities. Every graduate with a first earned it under the rules their university applied that year. The interesting questions are systemic: how the rules changed, what the data shows, and what you can control about your own marks while the sector sorts out its standards.
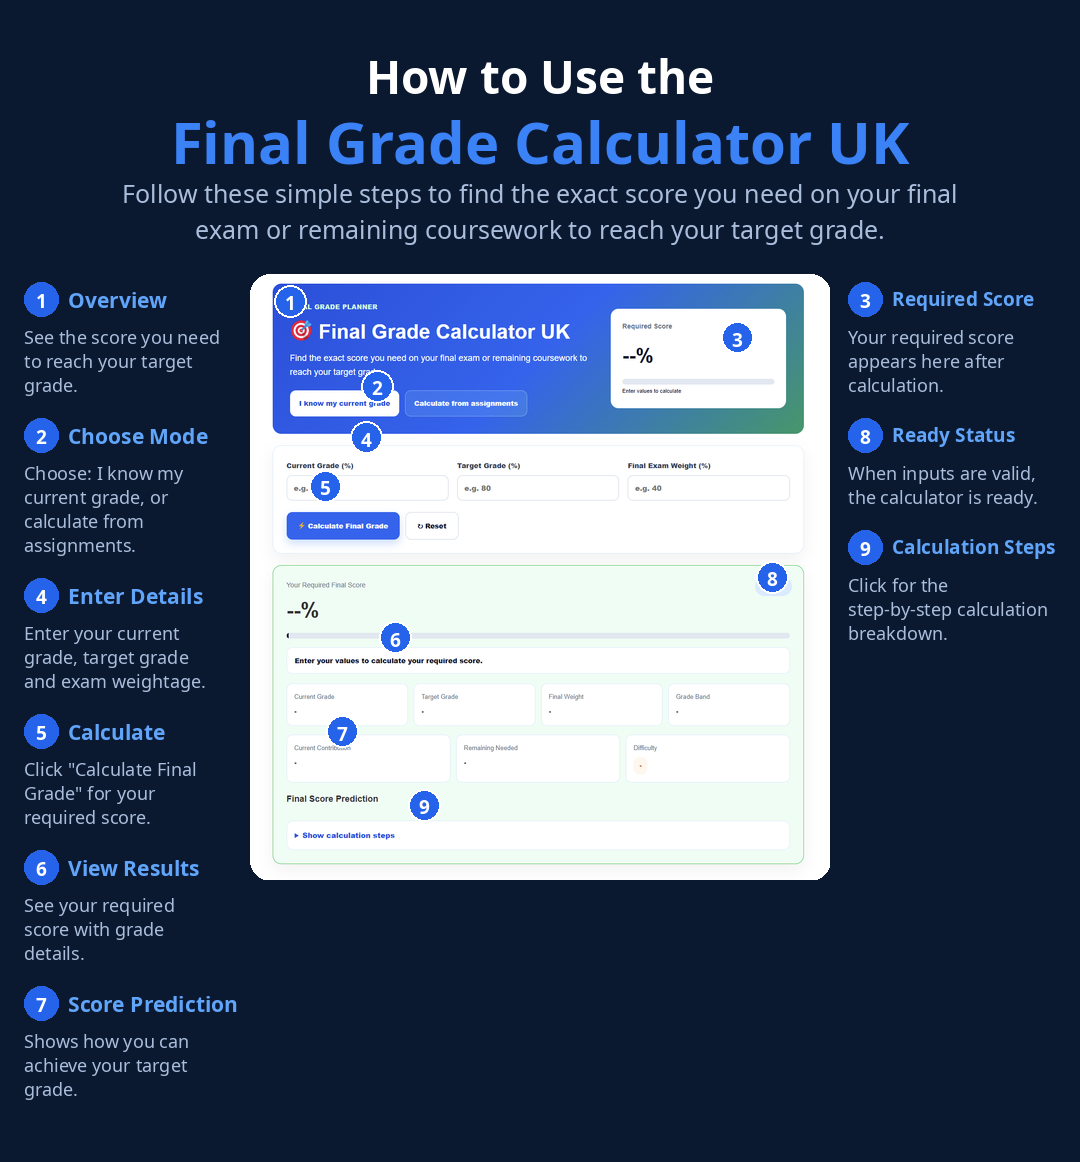
Click Here: Final Grade Calculator UK
The Headline Numbers: Firsts Nearly Doubled in 13 Years
Two organisations track the share of firsts, and it helps to know which is which. The Office for Students (OfS) covers England and publishes the detailed ‘analysis of degree classifications over time’, including the statistical modelling. The Higher Education Statistics Agency (HESA) covers the whole UK and publishes the raw attainment figures. They tell the same story in slightly different numbers:
| Academic year | Share of firsts | Source | What was happening |
|---|---|---|---|
| Early 1990s | ~8% | Sector/press estimates cited in recent reporting | A first was genuinely rare — roughly one graduate in twelve |
| 2006-07 | 12.6% | HESA series | The slow climb was already visible |
| 2010-11 | 15.8% | OfS (England) | The regulator’s baseline year — one in 6.3 graduates |
| 2018-19 | 30% | OfS | Firsts rose from 29% to 30% — the sector was already worried |
| 2019-20 | 36% | OfS | Lockdowns and ‘no-detriment’ policies hit the end of the academic year |
| 2020-21 | 37.7% | OfS (England) | The pandemic peak — the highest share ever recorded |
| 2022-23 | 29.6% | OfS (England) | Second year of decline after the peak |
| 2023-24 | 28.8% | OfS (England) | Third consecutive fall — still nearly double 2010-11 |
| 2023-24 | 29% | HESA (UK-wide) | 465,240 first degrees awarded; first-class share eased from 30% |
Three things to take from that table. First, the trend predates the pandemic. Firsts were already at 30 per cent in 2018-19 — double the 2010-11 figure — before Covid disrupted a single exam. The pandemic accelerated a climb that was well underway, it did not start it. Second, the correction is real but partial. The OfS’s latest analysis, published in January 2026, found firsts falling for the third consecutive year — 29.6 to 28.8 per cent — which deputy director of quality Jean Arnold described as the decade-long increase ‘continuing to slow and reverse’. Third, the baseline is what makes the story. Against 2010-11, even the corrected figure is a near-doubling. Against the early 1990s, it is roughly a tripling and a half.
The combined ‘good honours’ figure (firsts plus 2:1s) moved with it: 76 per cent of graduates got a first or a 2:1 in 2019, compared with roughly half twenty years earlier. When three-quarters of graduates land in the top two classifications, the classifications stop discriminating between candidates the way they used to — which is exactly why graduate employers lean so heavily on their own tests and assessment centres now.
What ‘Unexplained’ Actually Means
The most misunderstood number in the whole debate is the OfS’s ‘unexplained’ share. Here is what it is, precisely. For each graduating cohort, the regulator builds a statistical model that predicts the share of firsts it would expect given the cohort’s measurable characteristics — principally entry qualifications, subject of study and prior attainment. It then compares the prediction with reality. For 2023-24, the model predicted 17.7 per cent of graduates would get a first. The actual figure was 28.8 per cent. The gap — 11.1 percentage points — is the ‘unexplained’ attainment, which works out at nearly 40 per cent of all firsts awarded that year.
That is a striking statistic, and it is worth pausing on what it does and does not establish. It does not prove that any particular university inflated grades, or that any particular first is undeserved. A model that controls for entry qualifications and subject mix cannot see everything: it cannot measure improvements in teaching quality, better student support, changes in assessment design, or students simply working harder. The OfS says this explicitly — its report sets out a range of possible causes ‘including improvements to teaching and learning’, alongside factors ‘that could have an inflationary effect on students’ grades, such as changes to degree classification algorithms or to assessment practices.’
What the figure does establish is that the rise cannot be waved away as ‘students are just better qualified now’. If entry qualifications explained it, the model would have predicted it. The gap survives the controls — and the gap is where the sector’s self-examination has been focused ever since the May 2019 statement of intent, which we will come to below. For context, the unexplained share was higher at the pandemic peak: an earlier OfS analysis found 59 per cent of 2020-21 firsts could not be explained against 2010-11 performance. The direction since — 59, then 40 — is part of the slow-reversal story.
The January 2026 analysis also zoomed in to provider level, comparing 143 institutions against the sector average and their own 2010-11 awarding. The spread is enormous. At the University of Buckingham, 52 per cent of students got firsts in 2023-24 (up from 17 per cent in 2010-11), and 73 per cent of those firsts were ‘unexplained’ — the highest share in the data. Birmingham Newman University, the University of East London, Northumbria University and Manchester Metropolitan University all had at least two-thirds of their firsts categorised as unexplained. At the other end, Imperial College London — 53 per cent firsts, the highest among Russell Group universities, up from 31 per cent in 2010-11 — shows that high-tariff institutions inflate too: this is not a story about one type of university.
Worked Example 1: The Firsts-Parity Counterfactual
Percentages are abstract; cohorts are concrete. Take a typical mid-sized graduating cohort of 200 students and apply two different years’ firsts rates to it.
Step 1: the 1995 cohort. Firsts ran at roughly 8 per cent in the early 1990s. 200 × 0.08 = 16 firsts. The other 184 students — including the 17th-best student in the year — got 2:1s or below. A first meant finishing in the top 16 of 200.
Step 2: the 2023-24 cohort. Apply the OfS’s 28.8 per cent. 200 × 0.288 = 57.6 — call it 58 firsts. The 58th-best student in the year now graduates with a first — the same rank that earned a 2:1 a generation ago. The difference between the two cohorts is 58 − 16 = 42 extra firsts out of 200.
Step 3: the ‘unexplained’ slice. Apply the OfS’s 40 per cent unexplained share to the 58 firsts: 58 × 0.40 = 23.2 — call it 23 firsts that the regulator’s model cannot account for given the cohort’s entry qualifications and subject mix. That is the disputed territory: the remaining 35 firsts (58 − 23) sit where the model says they should.
The counterfactual’s honest moral is not ‘standards collapsed’ — it is that rank and reward have decoupled. A student ranked 30th in their year gets the same classification in 2023-24 that the 10th-ranked student got in 1995. Whether that is wrong depends on whether you believe degree classifications should measure absolute attainment, relative rank, or something in between — and UK universities have never fully agreed on that question, which is part of why the debate never ends.
Why It Happened: The Drivers Behind the Rise
No single cause explains a thirteen-year doubling. The evidence points to at least five overlapping drivers — and the honest answer is that nobody can apportion exact shares between them, which is precisely why the OfS sticks to the word ‘unexplained’.
1. Pandemic emergency assessment. The sharpest single movement in the data is the 2019-20 to 2020-21 jump: 36 to 37.7 per cent, the highest share ever recorded. Universities introduced ‘no-detriment’ and safety-net policies, moved exams online, and in many cases replaced invigilated exams with open-book or coursework assessment. The OfS’s provider investigations noted these as the backdrop to the peak. But — crucially — firsts were already at 30 per cent in 2018-19, double the 2010-11 figure, before Covid touched a single exam. The pandemic was an accelerant, not the origin.
2. Classification algorithms. This is the driver the sector has spent most effort fixing. A Quality Assurance Agency review published alongside the sector’s 2020 commitments found that about a third of institutions used some form of discounting (dropping students’ lowest marks from the final calculation), 30 per cent ran students’ marks through multiple algorithms and awarded the best result, and 85 per cent had a borderline policy with the potential to push marks up. Each of those is individually defensible as student-friendly design; stacked together across a cohort, they ratchet classifications upward. (A separate 2026 OfS ruling on one provider’s algorithm — which the regulator called inherently inflationary — shows the regulator is now treating algorithm design as a compliance question, not just a design choice. The detail lives in our dedicated piece on that ruling.)
3. The sector’s own reform programme. Universities have not been passive. In May 2019, Universities UK and GuildHE — on behalf of the UK Standing Committee for Quality Assessment — published a statement of intent committing the sector to tackle grade inflation. What followed was concrete: in July 2020, UK-wide principles for effective degree algorithms (one algorithm only, a maximum two-percentage-point ‘zone of consideration’ at boundaries, rounding only at the final stage, limits on discounting); in October 2019, the first UK-wide descriptors of what each classification actually looks like; and annual degree outcomes statements from providers, publishing their classification profiles and scrutiny. Sector surveys found 96 per cent of providers intending to use the algorithm guidance, 76 per cent using the classification descriptors, and 87 per cent making changes to their external examiner processes. In July 2022, UUK and GuildHE went further, pledging to return firsts and 2:1s to 2019 levels — the benchmark year before the pandemic spike. The three-year decline in firsts since 2020-21 suggests the programme is having an effect.
4. Entry qualifications didn’t rise with the grades. One natural hypothesis — maybe students just arrive better prepared — does not survive the data. A nine-year study of nearly 9,000 STEM students at a Russell Group university found mean entry tariff scores falling consistently from 2017-18 onwards — precisely the years firsts were rising fastest. Students were arriving less well-prepared on paper and leaving with better degrees. This is the divergence the OfS’s model captures statistically: the cohort’s measurable inputs cannot account for its outputs.
5. Genuine improvements — the honest unknown. Teaching did change over thirteen years: more structured feedback, better learning resources, more sophisticated assessment design, wider use of academic support. The OfS lists ‘improvements to teaching and learning’ first among possible causes, and it would be strange if over a decade of pedagogical investment produced zero improvement in outcomes. The uncomfortable truth is that this component and the inflationary component are observationally identical in the attainment data — a student who learns more and a student whose marks are rounded up both graduate with a first. That is why ‘unexplained’ is the right word and ‘unjustified’ would be the wrong one.
Worked Example 2: How a Two-Point Boundary Shift Moves a Cohort
Worked Example 1 showed what the national change looks like. This one shows the mechanism — how a tiny rule tweak inside one university moves dozens of students across a boundary, and why the sector targeted algorithms rather than lecturers.
The setup. Take a cohort of 300 finalists at a university using standard UK boundaries: 70 for a first, 60 for a 2:1, 50 for a 2:2, 40 for a third. Marks bunch around boundaries — this is one of the most replicated findings in assessment research, because students aim at targets and markers hesitate at borderlines. Suppose the mark distribution is:
| Mark band | Students | Classification under the rules |
|---|---|---|
| 70.0 and above | 84 | First |
| 68.0 – 69.9 (borderline zone) | 33 | 2:1, unless uplifted |
| 67.0 – 67.9 (just below borderline) | 21 | 2:1 |
| 60.0 – 66.9 | 102 | 2:1 |
| Below 60.0 | 60 | 2:2 or below |
Step 1: the baseline. 84 students at 70.0+ means 84 ÷ 300 = 28.0 per cent firsts — almost exactly the sector average in 2023-24. The 33 students in the 68.0–69.9 zone sit in the borderline zone; under a strict rule (uplift only for, say, a majority of final-year credits at 70+), perhaps 10 of them are uplifted. Firsts = 84 + 10 = 94, or 31.3 per cent.
Step 2: the rule change. The university revises its borderline policy: the zone widens to 67.0–69.9, and anyone in it with ‘a preponderance of marks at the higher classification’ — a soft criterion — is uplifted. Now the uplifted group is the 33 in the old zone plus the 21 just below it: 54 students. Suppose 40 of the 54 meet the soft criterion. Firsts = 84 + 40 = 124, or 41.3 per cent — a 10-percentage-point jump in the firsts rate from a change no student would notice and no lecturer voted on.
Step 3: the sector implication. 41.3 − 31.3 = 10.0 percentage points. Applied to a national cohort of ~465,000 first-degree graduates (HESA 2023-24), a 10-point shift is roughly 46,500 graduates reclassified from 2:1 to first by one softened rule. This is not a claim that any real university did exactly this — it is arithmetic showing why the UUK/GuildHE algorithm principles capped the zone of consideration at two percentage points and restricted rounding to the final stage. Small machinery, large consequences.
The practical takeaway for you: your classification is not only a function of your marks, but of your university’s machinery — its algorithm, its borderline zone, its weighting of years. Two students with identical transcripts can graduate with different classifications at different universities. Which is why knowing your own institution’s rules — published in its academic regulations and degree outcomes statement — is one of the highest-value things a student can do. Our Degree Classification Calculator lets you model exactly where your marks land under typical weightings.
Does Degree Grade Inflation Devalue YOUR Degree?
The fear students voice most often is blunt: ‘is my degree worth less than it used to be?’ The honest answer depends on who is reading your classification — because different audiences use it for different jobs. Here is the decision framework:
| Who reads your classification | What they use it for | Has inflation changed it? |
|---|---|---|
| Graduate schemes (most large employers) | A 2:1 threshold filter on applications — usually the first cut | Barely. The 2:1 filter has not been tightened; a 2:1 still clears it. Competition inside the filter is fiercer, so tests and assessment centres carry more weight |
| Taught masters admissions | A 2:1 (often 60%+) minimum; Merit/Distinction lines for funding | Little. The entry lines are absolute marks, not percentiles — 60 is still 60. See our 2:2-to-2:1 recovery guide if you are near the line |
| PhD funders and doctoral programmes | First or high 2:1 plus Distinction/Merit as a quality signal | Somewhat. More firsts means the signal is noisier — which is why funders weight proposals, references and research experience more heavily |
| Employers verifying your CV | Confirming the award is genuine (via HEDD, with your consent) | No. Verification confirms the award, classification and dates — inflation does not make a real degree fake |
| Regulated professions (medicine, law, teaching) | Degree plus professional exams, placements and fitness standards | Least. The professional gate — exams, training contracts, QTS — does the real filtering, and it has not moved |
The pattern: the gates have not moved, but the queue through them has grown. A first still opens every door a first ever opened; it just no longer distinguishes you from as many people once you are through it. That is a real change, but it is a change in competitive context, not a change in the value of your own achievement — and it points to the same conclusion whatever your classification: the differentiator has moved to what sits around the classification. Work experience, technical skills, a strong final-year project, good references. Employers never hired classifications; they hired people, using classifications as a first sort.
One more piece of reassurance with numbers behind it. Even at 28.8 per cent, more than seven in ten graduates did not get a first — and the OfS’s own modelling says the expected share was 17.7 per cent, meaning most firsts awarded sit where the model expects them. The ‘firsts are handed out’ version of this story is not what the data says; the data says firsts are more common than the cohort’s entry profile predicts, and the sector is already correcting. If you are sitting on a strong average, our guide to what counts as a good university average puts your marks in context.

Five Myths vs the Data
| The myth | What the data actually says |
|---|---|
| “Firsts are just handed out now.” | 71.2 per cent of 2023-24 graduates did not get a first — and the OfS model expects 17.7 per cent, so the majority of firsts sit where the model predicts. ‘More common than expected’ is not ‘handed out’. |
| “Exams just got easier during Covid.” | The trend predates the pandemic: firsts hit 30 per cent in 2018-19, double the 2010-11 figure, before a single lockdown exam. Covid accelerated the climb; it did not start it. |
| “Only lower-tariff universities inflate.” | Imperial (53% firsts), UCL (41%) and Durham (40%) are among the highest awarders in the country — all elite, high-tariff institutions. The OfS’s provider analysis found unexplained attainment across the sector, not in one corner of it. |
| “The OfS will take my first away.” | No. The regulator acts on current and future standards — investigations, action plans, algorithm scrutiny — not retrospective downgrades. Your awarded classification stands. |
| “A 2:1 is worthless now that firsts are common.” | The 2:1 remains the single most-used threshold in graduate recruitment and postgraduate admissions, and it has not been raised. Roughly half of graduates still land in the 2:1 band — it is the workhorse classification of the UK labour market, not a consolation prize. |
What You Can Do: Focus on the Marks Within Your Control
Sector data is interesting; your transcript is actionable. Whatever the national firsts rate does over the next five years, these are the levers that actually move your classification:
1. Learn your university’s machinery. Find your academic regulations and read the classification algorithm: single or multiple algorithms? What is the borderline zone (68–69.9 is typical, but yours may differ)? How are the years weighted — 25:75, 20:80, 30:70? Is there discounting of the lowest module? Students who know the machinery can aim precisely; students who don’t are navigating blind. Search your university name plus ‘degree outcomes statement’ for the public version of the story.
2. Protect the heavily weighted years. At most universities the final year carries the most weight — often 70–80 per cent of the classification. A 2-point gain in final year is worth three to four times a 2-point gain in second year under a 25:75 split. Allocate your effort where the algorithm allocates the weight, and model it with the Final Grade Calculator UK before each assessment period.
3. Play the borderline deliberately. The 67–69.9 band is where classifications are genuinely contestable — Worked Example 2 showed why. If your average sits there, find out your university’s uplift criteria early (some require a proportion of credits at the higher band, some consider final-year trajectory), and direct marginal effort at the modules most likely to tip the balance.
4. Build the differentiators inflation can’t touch. A first plus a summer internship beats a first alone; a 2:1 plus a strong dissertation and a reference that names specifics beats a bare first. The queue through the gates is longer now — so be the candidate with the second signal. Placements, part-time work in your field, technical skills, volunteering: none of these are subject to grade inflation.
5. Use the formal routes when they genuinely apply. Extenuating circumstances and appeals exist for real disruption and real marking error — not as grade-boosting tactics, but as the system’s own correction mechanisms. Used honestly and early, they protect the marks you earned; used cynically, they waste everyone’s time. Know the deadlines before you need them.
What is degree grade inflation?
Degree grade inflation is the sustained rise in the share of top degree classifications awarded by UK universities without a matching rise in the underlying achievement that the grades are supposed to measure. The standard illustration: in 2010-11, 15.8 per cent of English graduates got a first; in 2023-24, 28.8 per cent did. The Office for Students calls the part of the rise its statistical model cannot explain ‘unexplained attainment’ — around 40 per cent of firsts in 2023-24. Inflation matters because classifications are a currency: employers, masters programmes and funders all read them, so changes in their meaning change what your degree signals.
What percentage of UK students get a first now, and how does that compare with 2010?
England (Office for Students): 28.8 per cent of graduates got a first in 2023-24, down from a 37.7 per cent pandemic peak in 2020-21, but still nearly double the 15.8 per cent recorded in 2010-11. UK-wide (HESA): 29 per cent of first degrees were first class in 2023-24, down slightly from 30 per cent the year before. The two sources cover slightly different populations (England vs UK-wide) but tell the same story: a long climb, a pandemic spike, and a partial retreat that still leaves firsts far above 2010 levels.
What does ‘unexplained’ mean in the OfS analysis of degree classifications?
It is a statistical term, not an accusation. The OfS builds a model that predicts what share of firsts it would expect given the characteristics of each year’s graduating cohort — entry qualifications, subject mix and prior attainment — and compares the prediction with what actually happened. For 2023-24 the model predicted 17.7 per cent firsts; the real figure was 28.8 per cent, a gap of 11.1 percentage points. That means nearly 40 per cent of the firsts awarded could not be explained by the modelled factors. The OfS stresses the rise could partly reflect genuine improvements in teaching and learning — ‘unexplained’ means the model cannot account for it, not that every unexplained first is undeserved.
Is my degree worth less because of grade inflation?
Not in the ways that matter most. The gates a classification opens — the 2:1 threshold on most graduate schemes, the 2:1-plus or Merit/Distinction lines for taught masters and PhD funding — have not moved: a first still clears every one of them. What has changed is scarcity: a first in 2023-24 is held by roughly one graduate in 3.5 rather than one in 6.3, so the differentiator between candidates has shifted toward work experience, skills, references and interview performance. If anything, students with strong marks plus experience are better placed than students with either alone. Our guide to whether your degree classification matters to employers walks through each audience.
Can the OfS take away or downgrade degrees that were already awarded?
No. The Office for Students regulates standards for current and future awards — it investigates providers whose recent attainment cannot be explained and requires action plans — but it does not retrospectively downgrade graduates’ classifications. Your degree certificate is a finished legal record of the award your university’s exam board made. Universities UK’s July 2022 pledge committed the sector to returning firsts and 2:1s to 2019 levels going forward, not to rewriting past results.
Do employers care about grade inflation when they hire graduates?
Most graduate employers still run their hiring around the same classification thresholds — the 2:1 filter on most schemes has not been tightened in response to inflation — and verify awards through HEDD with the graduate’s consent, which confirms the award, classification and dates of study. What has changed is competition inside the filters: with more firsts and 2:1s in circulation, recruiters lean harder on second signals — application tests, assessment centres, internships and references. A good classification still gets you through the door; it just no longer walks you through the whole building.
Which universities award the most first-class degrees?
Recent HESA-based reporting puts Imperial College London at around 53 per cent of graduates awarded firsts — the highest among Russell Group universities — followed by UCL at around 41 per cent and Durham at around 40 per cent, against a UK average of roughly 30 per cent. The OfS’s 2023-24 provider-level analysis named the University of Buckingham (52 per cent firsts, 73 per cent of them ‘unexplained’ — the highest share in the data) and found at least two-thirds of firsts unexplained at Birmingham Newman, the University of East London, Northumbria and Manchester Metropolitan. The spread matters: national averages hide very different local stories, which is why checking your own university’s figures beats quoting the headline.
How can I check my own university’s grade-inflation record?
Since 2019 universities have published annual ‘degree outcomes statements’ — public documents, usually on the university website, that show the institution’s classification profile over recent years and the actions it is taking to protect standards. Search your university’s name plus ‘degree outcomes statement’ and look for the firsts trend since 2010-11 and any mention of algorithm changes or borderline policy. The OfS’s January 2026 analysis also compared 143 providers against the sector average and their own 2010-11 awarding, so the regulator’s data tables are the independent cross-check.
Conclusion
Degree grade inflation is real, measurable, and — for the third year running — slowly reversing. The OfS’s January 2026 analysis put the numbers beyond argument: 28.8 per cent of English graduates got a first in 2023-24, nearly double the 15.8 per cent of 2010-11, with around 40 per cent of those firsts unexplained by the cohort’s entry qualifications and subject mix. The sector knows it, has known it since the 2019 statement of intent, and has spent five years rebuilding the machinery — single algorithms, capped borderline zones, published degree outcomes statements — that let the numbers drift in the first place.
But the number that matters to you is not 28.8 per cent. It is your own average, your own university’s algorithm, and your own borderline position — the three things this article’s worked examples showed you how to think about arithmetically. The gates your classification opens have not moved; the queue through them has grown; and the students who thrive in a longer queue are the ones with marks they understand and differentiators no inflation can touch. Work out where you stand with the Final Grade Calculator UK, learn your institution’s rules, and aim with precision — because in a system this noisy, the students who do the maths are the ones who win the margins.